
Cassandra is a NoSQL database from Apache Software Foundation that is known for its BigTable data model. It provides highly scalable services with no single point of failure with its large volumes of data distributed across different servers. The main features of Cassandra are fault tolerance, replication and clustering for redundancy and failover, decentralized and scalable architecture and tunable consistency.
Monitoring the performance of Cassandra database is very important to rule out any functional deficiencies in the database system. Applications Manager make the life of IT administrators easier by monitoring the key performance indicators of Cassandra and providing the necessary operational intelligence. This helps the administrators fine tune performance and utilize Cassandra to the fullest extent.
Applications Manager uses JMX MBeans to collects various attributes and metrics to monitor the cassandra database. Here is what we offer in terms of Cassandra monitoring:
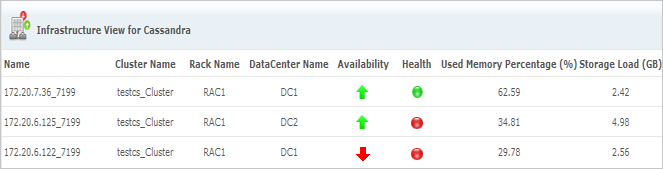
1. Infrastructure view: View all the nodes in the Cassandra cluster in a single view
The infrastructure view shows the details and relationship of all the nodes in the Cassandra cluster.
2. Monitor Key Performance metrics – CPU Usage, Memory Utilization & Storage Load
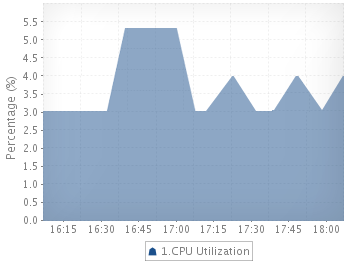 CPU Usage give an idea of the amount of processor used by the application and also assessing the health of the Cassandra database system. The higher the CPU, the more the stress on the application.
Memory Utilization tracks the amount of memory used by the application and also the amount of free memory available.
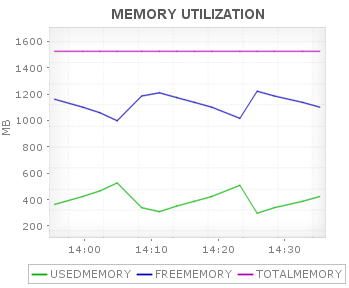 If the memory utilized keeps increasing, then it may lead to ‘out of memory’ errors and hence the application will be killed abruptly. Thus monitoring memory utilization helps in identifying memory leak in the application.
Storage load is the amount of disk space used by the application. This attribute helps to determine the capacity of the Cassandra database system.
3. Assessing load
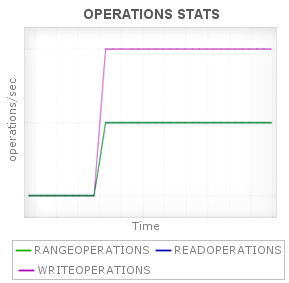 Applications Manager collects information about the number of operations since server started which helps in assessing the load on the Cassandra database server.
The attributes monitored include the number of range operations, number of read operations and number of write operations. The counter type attributes are converted into number of operations per second.
Also attributes that provide information about the latency (in seconds) of operations since the last time the attribute was read, are also collected for range, read and write operations.
4. Diagnose delay in the system
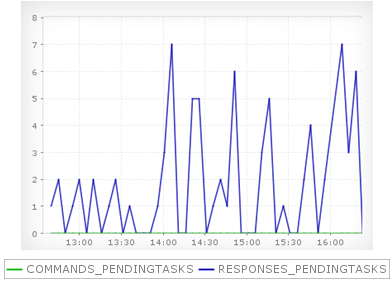 Pending tasks is important information to diagnose delay in the Cassandra database system. Applications Manager monitors most of these pending tasks such as the number of commands pending for execution, number of responses pending to be returned, number of CommitLog pending tasks waiting in the queue, number of compaction pending tasks waiting in the queue to be executed, etc.
Monitoring all these pending task helps in diagnosing the health of the Cassandra database system.
5. Comprehensive analysis of different stages in the thread pools
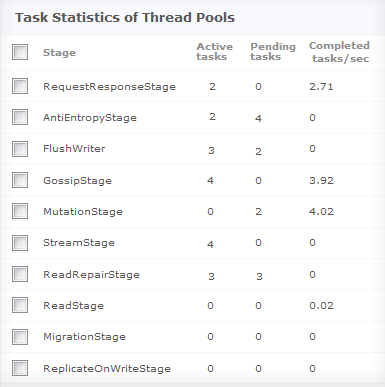 Cassandra database has threads spanning different stages of execution. The different task counts of any thread are active, pending, completed, blocked and all time blocked. Each thread is meant for a specific job and finding the number of tasks in them helps in better understanding of that thread’s tasks.
For example, ‘FlushWriter’ thread writes the sorted flushes to disk. If there are more pending tasks in this, it means Cassandra is accepting more writes into memory, but the writes to disk are slower.
Applications Manager monitors all tasks in all the thread pool stages and displays it in a unified table so that all metrics are viewed at one place.
Applications Manager also monitors the number of messages that are dropped in different message type like read, read_repair, binary, range_slice and request_response. This will help in determining overload in the Cassandra database server.
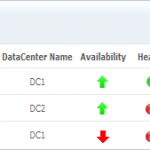
6. Overview of the cluster nodes status
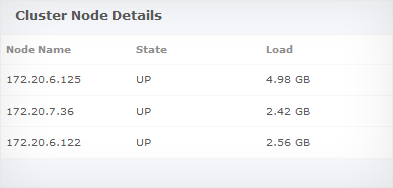 This view shows the state and load on all the nodes in the cluster as one table view.
The cluster nodes will belong to one of the different states such as live nodes, unreachable nodes, leaving nodes, moving nodes and joining nodes.
7. Identify the root cause for critical problems through JVM stats
 Finding the root cause of ‘out-of-memory’ errors are always tough. You need to know all the thread states in the application at that particular moment when the error occurred. Configuring thresholds will notify you only after the event, but you want to know what happened at the exact time of the error.
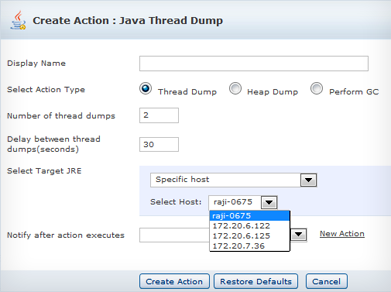
You can overcome this problem by configuring a thread/heap dump for any specified server or list of servers. This helps in analyzing and identifying the root cause for critical JVM errors.
That in a nutshell, is what Applications Manager can offer for your Cassandra servers. To see it for yourself, take a test drive of Applications Manager 11 today and let us know your comments.
Related Read: MongoDB Monitoring in Applications Manager.
You Can Learn More About the ManageEngine Product Line By Going to manageengine.optrics.com
The original article/video can be found at Monitoring Cassandra Cluster Databases with Applications Manager