
This blog will give you a good understanding about the Dashboard in NetFlow Analyzer. The Enterprise Edition of NetFlow Analyzer has two dashboards
1) Collector Dashboard
2) Network Snapshot
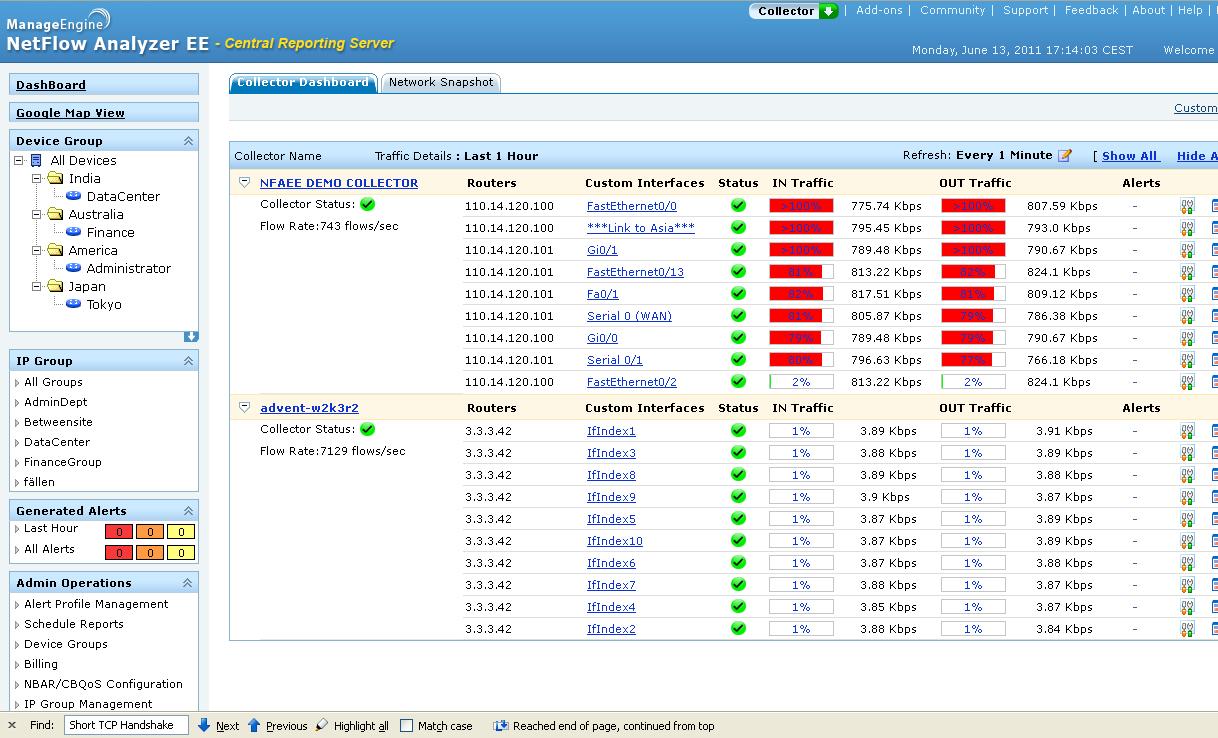
Collector Dashboard:
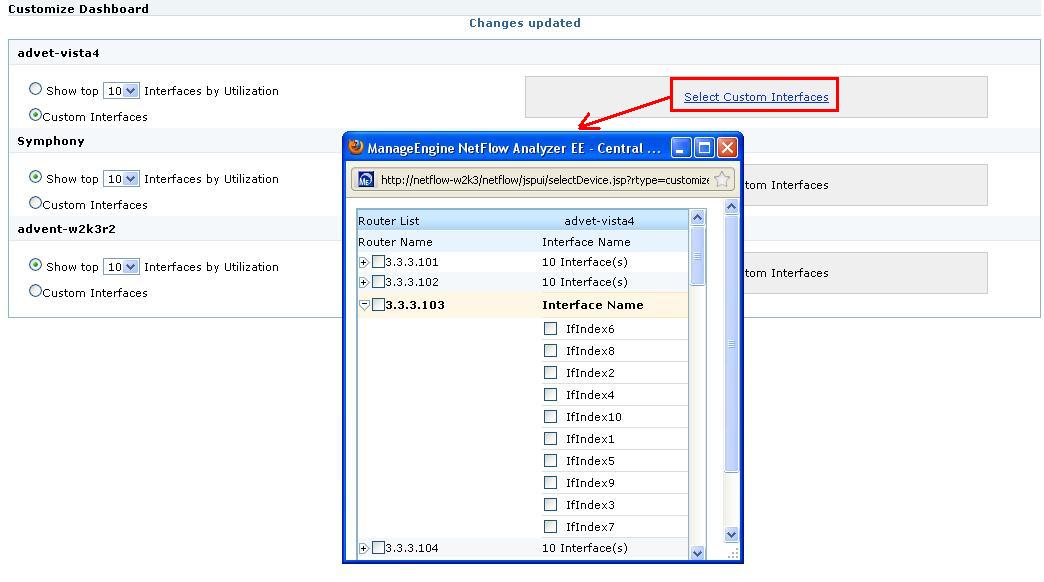
This collector dashboard will give information about the top utilized interfaces with respect to each collector. The top N can be selected from the Customize button available on the top right corner of the Collector dashboard.
This customize dashboard page also gives you options for deciding if you would like to see selected interfaces. Say, you have a couple of critical interfaces which needs continuous monitoring, you can make use of this option.
When you need to get the information on a collector basis you can make use of the collector dashboard. Would you like to see the top users from the complete network? The Network Snapshot dashboard, which gives the information from the complete network.
Network Snapshot:
This is a new Dashboard available from build 7500 onwards, this helps in complete Network monitoring. This dashboard helps troubleshooting the network as a whole.
It displays details categorized under the following heads.
1) Top Interfaces
2) Top Applications
3) Top QoS
4) Top IP Groups
5) Top Conversations
6) Recent Alerts
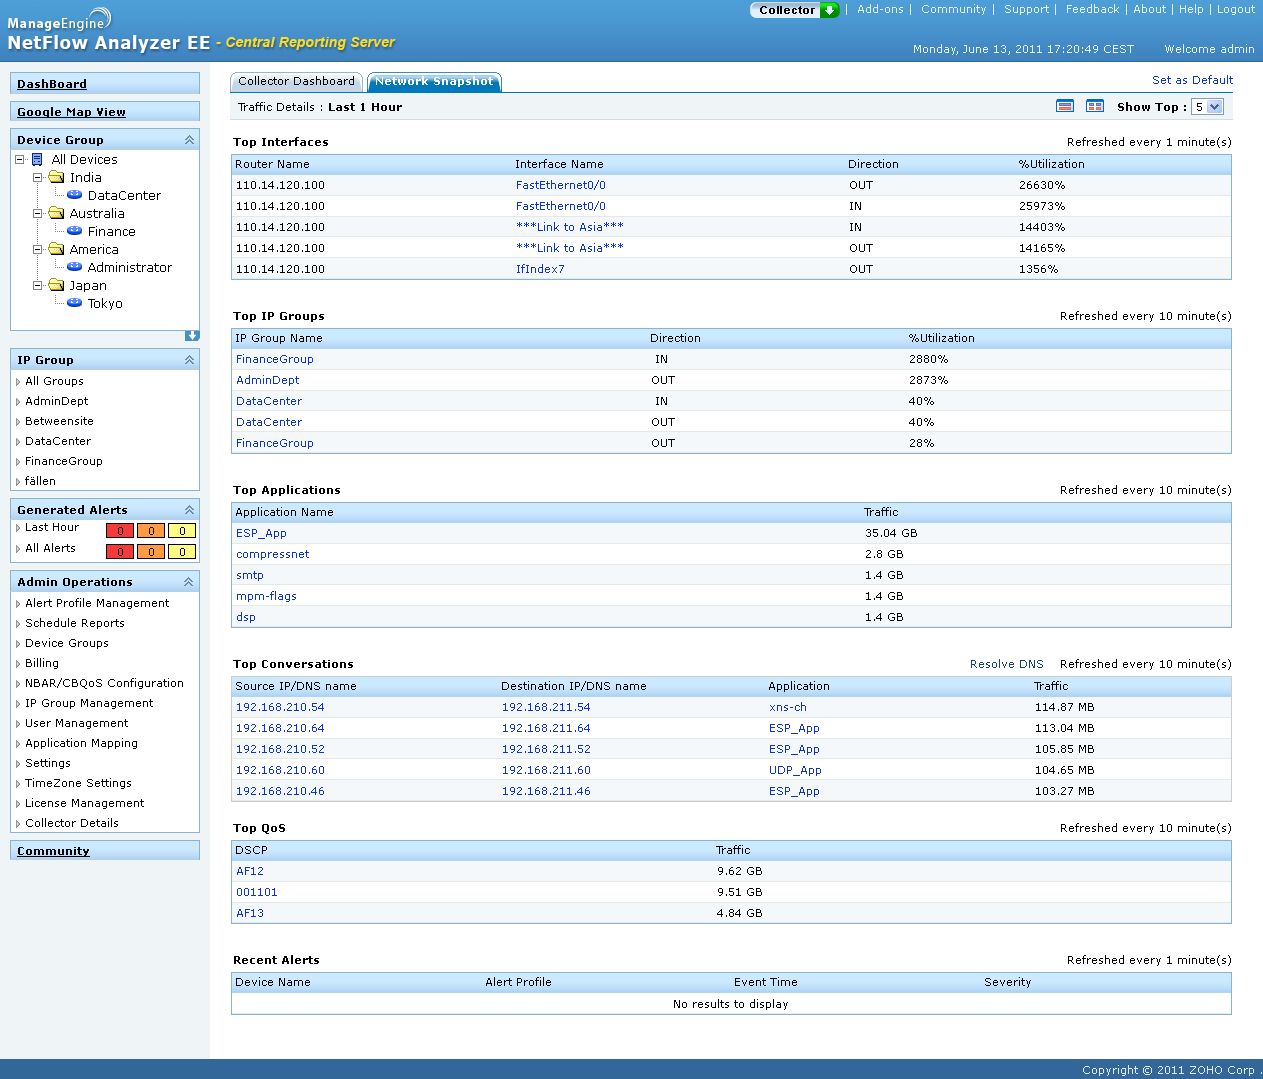
You can make use of the this dashboard page to get a quick view of the complete network and you do not have to search between each collector or routers.
You can decide as to which has to be the default dashboards (dashboard which you wish to see as soon as you login). This can be done by clicking on “Set as Default” button.
Hope dashboards available in NetFlow Analyzer Enterprise Edition helps in better troubleshooting of distributed network.
Download the 30 day trial from here.
Praveen Manohar
NetFlow Analyzer
Technical Team
Download | Interactive
Demo | Twitter |
Customers
/p>
You Can Learn More About the ManageEngine Product Line By Going to manageengine.optrics.com
The original article/video can be found at Dashboards in NetFlow Analyzer Enterprise Edition.